Gold

Gold is one of the least reactive chemical elements, solid under standard conditions. The metal therefore occurs often in free elemental (native) form, as nuggets or grains in rocks, in veins and in alluvial deposits. Less commonly, it occurs in minerals as gold compounds, usually with tellurium. Gold resists attacks by individual acids, but it can be dissolved by the aqua regia (nitro-hydrochloric acid), so named because it dissolves gold. Gold also dissolves in alkaline solutions of cyanide, which have been used in mining. It dissolves in mercury, forming amalgam alloys; is insoluble in nitric acid, which dissolves silver and base metals, a property that has long been used to confirm the presence of gold in items, giving rise to the term acid test. Besides its widespread monetary and symbolic functions, gold has many practical uses in dentistry, electronics, and other fields. Its high malleability, ductility, resistance to corrosion and most other chemical reactions, and conductivity of electricity has led to many uses, including electric wiring, colored-glass production, and gold leafing.
Gold market basics
According to the US Geological Survey (USGS), Australia is the world’s second-largest gold producing country after China, which it estimated to have produced 455 t of gold in 2016. In third place was Russia, followed by the US, Canada and Peru. South Africa, once the world largest gold producing country, was seventh with 140 t.
China in 2015 was the planet’s largest gold market in both supply and demand terms, with yearly gold production up 650% to 462 t from 60 t in 1985..
Gold price latest:
![[Most Recent Quotes from www.kitco.com]](http://www.kitconet.com/images/sp_en_6.gif)
Click HERE to view latest price trends
Gold price: 12 months
Click HERE to view price per gram in different currencies
Conversion: 1 gram = 0.03215 troy ounces
Gold weight conversion
The gold price ended 2016 up 8%. Having risen 25% by the end of September, gold relinquished some of its gains in Q4 following Trump’s conciliatory acceptance speech and the FOMC’s interest rate rise.

Gold has lost value for three straight years, starting in 2013.
Gold prices declined slightly over 2014 as losses in the year’s final day of trading prevented the metal from merely breaking even on an annual basis. For the year, gold prices declined 1.5%, compared with the Dec. 31, 2013, settlement price of $1,202.30 an ounce.
At the end of 2013 the gold price closed $472.90 or 28.2% lower than in 2012; the first time in 12 years that the price dropped. However, global mined gold output rose 4% in 2013 to 2,982 tonnes.
Click HERE for links to gold supply and demand
List of gold stocks with latest financial data
Value Creation in the Gold Mining Sector (Goldcorp)
1. Grasberg Mine (Indonesia) - 1,444,000 ounces - Freeport-McMoRan - view chart
2. Cortez (U.S.A.) - 1,421,000 ounces - Barrick Gold - view chart
3. Yanacocha (Peru) - 1,293,000 ounces - Newmont - view chart
4. Goldstrike (U.S.A.) - 1,088,000 ounces - Barrick Gold - view chart
5. Veladero (Argentina) - 957,000 ounces - Barrick Gold - view chart
6. Vaal River (South Africa) - 831,000 ounces - Anglogold Ashanti - view chart
7. The Super Pit ( Kalgoorlie-Boulder, WA, Australia) - 794,000 ounces - Joint venture owned by Newmont and Barrick
8. West Wits (South Africa) - 792,000 ounces - Anglogold Ashanti - view chart
9. Lagunas Norte (Peru) - 763,000 ounces - Barrick Gold - view chart
10. Boddington mine (Boddington, WA, Australia) - 741,000 ounces -- Newmont - view chart
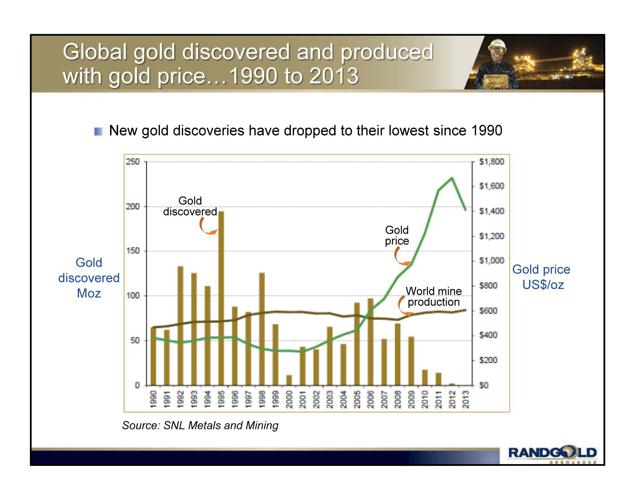
The Western World average for grassroots discoveries of new gold mines was $55/oz for the period 1985 to 2002 according to a WMC paper or $30/oz according to the Metals Economics Group 2004 paper “Major Gold Discoveries Worldwide.”
Click HERE for an overview of GOLD MINING IN AFRICA (MBendi)
List of mining companies operating within the Birimian Greenstone Belts in Africa
List of gold deposits in the Birimian Greenstone Belts:
| Deposit | Country | Contained Ounces |
| Obuasi | Ghana | 42,300,000 |
| Tarkwa | Ghana | 30,000,000 |
| Afaho | Ghana | 27,127,024 |
| Akyem | Ghana | 20,300,000 |
| Loulo | 18,500,000 | |
| Sadiola | Mali | 18,500,000 |
| Prestea | Ghana | 10,000,000 |
| Dossi | Burkina Faso | 9,400,000 |
| Teberbie | Ghana | 9,200,000 |
| Siguiri | Guinea | 7,500,000 |
| Mana | Burkina Faso | 7,100,000 |
| Morila | Mali | 7,000,000 |
| Inata | Burkina Faso | 6,700,000 |
| Essakane | Burkina Faso | 6,200,000 |
| Kiaka | Burkina Faso | 5,900,000 |
| Konongo | Ghana | 5,600,000 |
| Bomboré | Burkina Faso | 5,300,000 |
| Syama | Mali | 5,200,000 |
| Bissa Hill | Burkina Faso | 5,100,000 |
| Bibiani | Ghana | 5,000,000 |
| Chirano | Ghana | 5,000,000 |
| Tongon | Cote d’ivoire | 4,500,000 |
| Banfora | Ghana | 4,500,000 |
| Yatela | Mali | 4,500,000 |
| Gaoua | Burkina Faso | 4,400,000 |
| Fekola | Mali | 4,200,000 |
| Abosso | Ghana | 4,000,000 |
| Sabodala | Mali | 4,000,000 |
| Massawa | Mali | 3,600,000 |
| Bélahouro | Burkina Faso | 3,500,000 |
| Tabakoto-Segala | Mali | 3,500,000 |
| Karma | Burkina Faso | 3,400,000 |
| Konkera | Burkina Faso | 3,300,000 |
| Bogoso | Ghana | 3,300,000 |
| Batie West | Burkina Faso | 3,100,000 |
| Damang | Ghana | 3,000,000 |
| Obotan | Ghana | 2,800,000 |
| Samira Hill | Burkina Faso | 2,500,000 |
| Iduapriem | Ghana | 2,300,000 |
| Houndé | Burkina Faso | 2,200,000 |
| Taparko | Burkina Faso | 2,200,000 |
| Vindaloo | Burkina Faso | 2,200,000 |
| Natougou | Burkina Faso | 1,800,000 |
| Youga | Burkina Faso | 1,600,000 |
| Bonikro | Cote d’ivoire | 1,300,000 |
| Kalsaka/Sega | Burkina Faso | 1,200,000 |
| Poura | Burkina Faso | 1,200,000 |
| Tanlouka | Burkina Faso | 1,200,000 |
| Salman | Ghana | 1,200,000 |
| Bouly | Burkina Faso | 1,100,000 |
| Yaramoko | Burkina Faso | 1,100,000 |
| Souma | Burkina Faso | 760,000 |
| Nabanga | Burkina Faso | 700,000 |
| Mapan | Ghana | 700,000 |
| Sartenga | Burkina Faso | 651,000 |
| Ronguen | Burkina Faso | 500,000 |
| Bondi | Burkina Faso | 400,000 |
| Kubi | Ghana | 400,000 |
| Ouare | Burkina Faso | 300,000 |
| Balogo | Burkina Faso | 200,000 |
 Source: The Spectator
The meek shall inherit the earth, but not the mineral rights.
-Jean Paul Getty
